Below is a sample of some of charts that were included in our recent emails to clients, which also include commentary and market analysis.
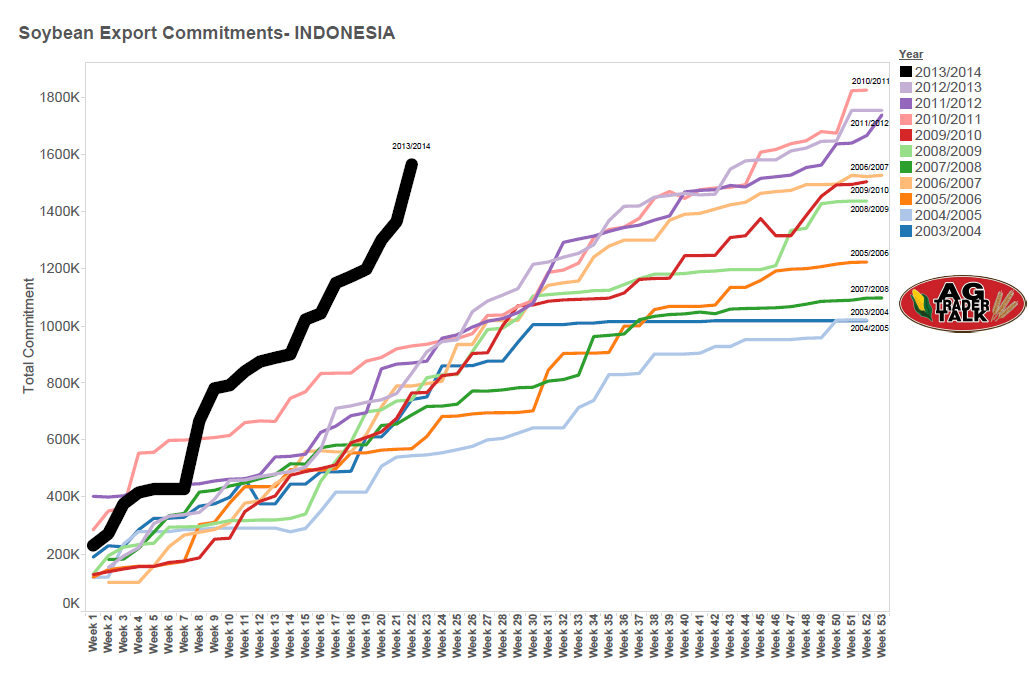
First is a historical comparison showing Indonesian commitments of US soybeans. Being able to run historical export sales and commitment paces, and at a country-specific level, allows us to quickly identify changes in demand.
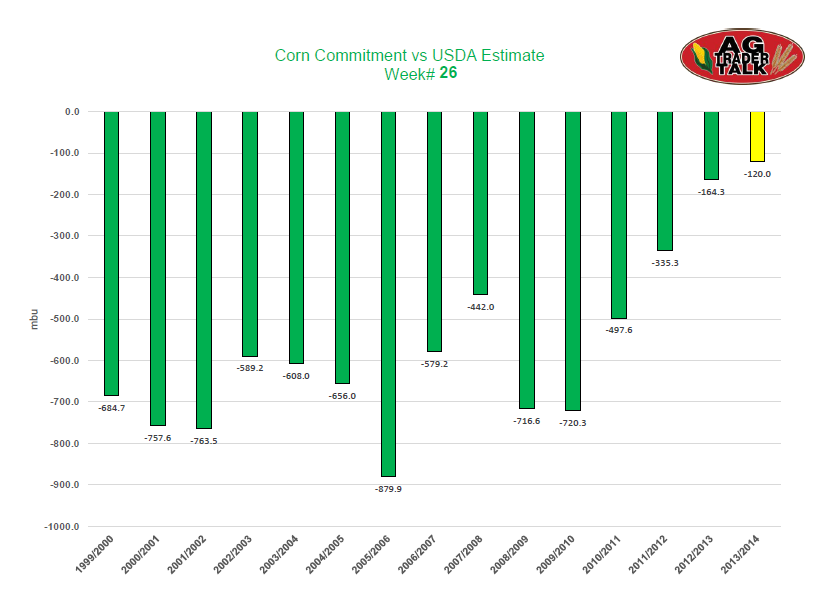
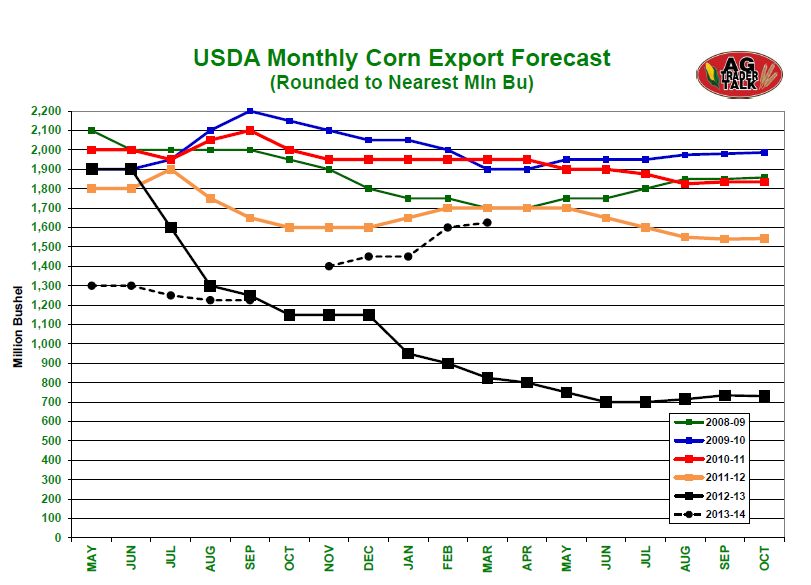
For each week’s USDA export sales report we provide a range of analysis and charts covering corn, soybeans, meal, oil, and wheat by class. This includes historical comparisons and relationships to USDA projections. Below is the historic US corn export commitment during week 26 of the marketing year, compared to each year’s USDA export projection.
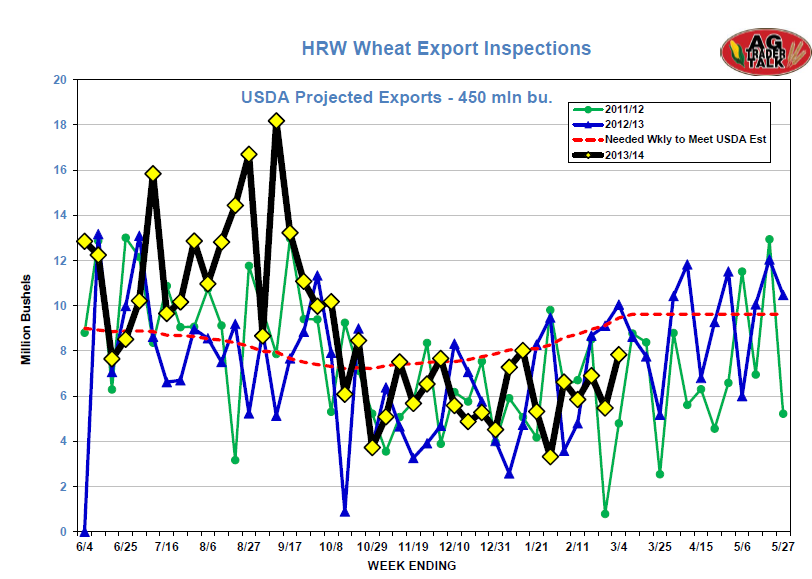
We also provide detailed analysis on US export inspections, including wheat inspections by class and destination, and amount needed to meet USDA projections.
Our inspections emails includes added statistics and data not included in the standard USDA inspections report.
Additionally we provide a in-depth view on crop production, especially the in the US. We provide a range of detailed maps and analysis to help identify production potential and impacts.
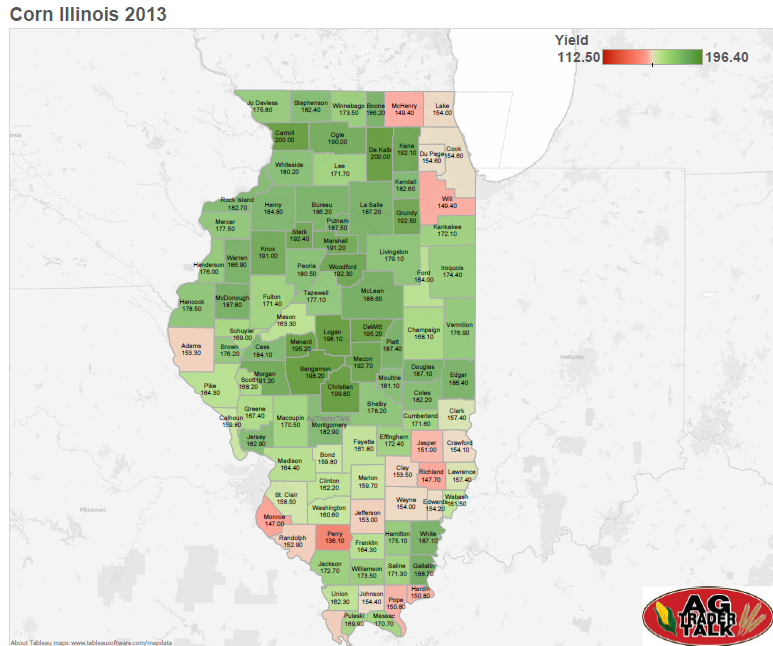
This is a video we published during US government shutdown in October. It cover the yield reports we had been receiving and tracking by farmers and industry contacts in the midwest.
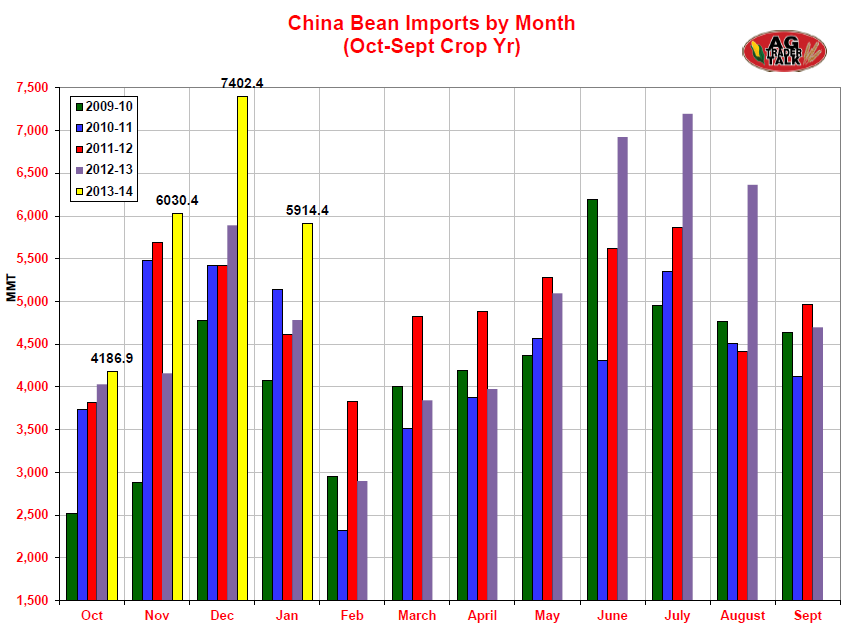
In addition we track customs and trade data for major agricultural players such as US, Brazil, Argentina, China, Canada and the European Union.
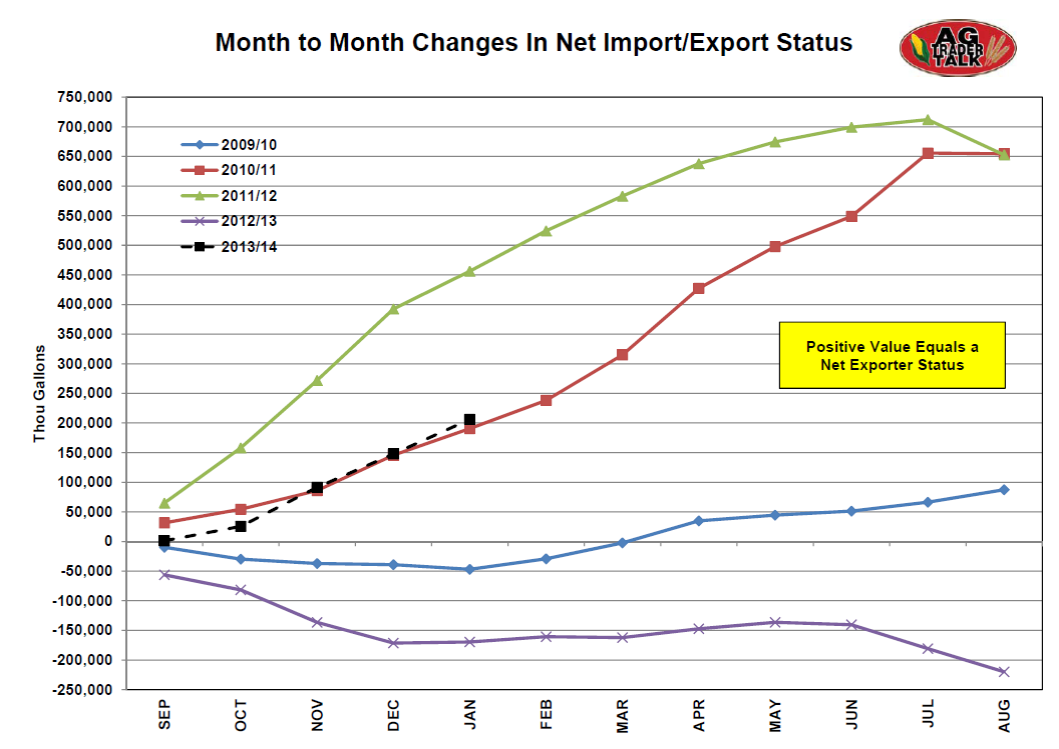
Below is the US trade balance of ethanol, tracking if the US is a net importers or exporter.
For major reports such as USDA’s Supply and Demand report we provide a large range of historical analysis, including monthly changes to individual balance sheet items to put the changes in context.
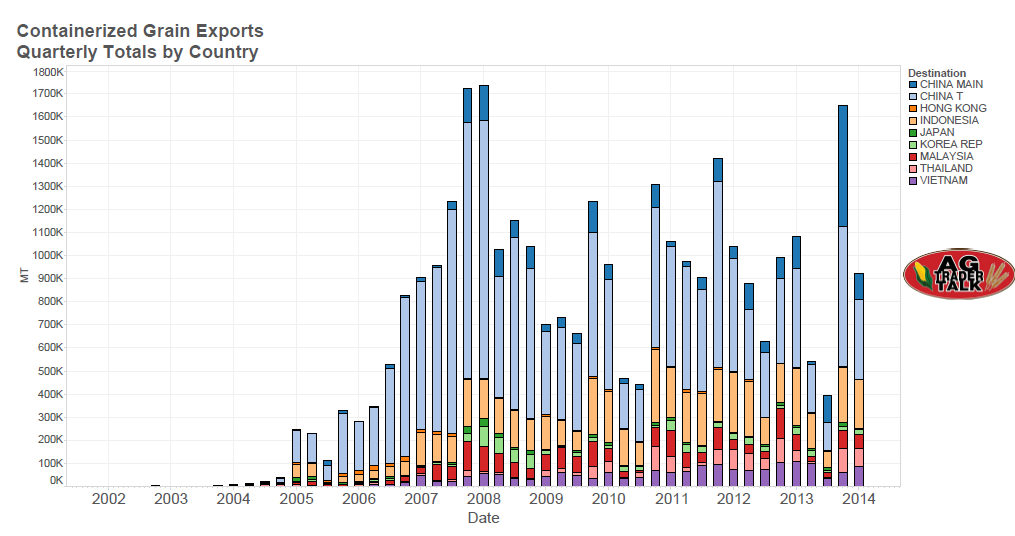
Utilizing our data resources we also publish original research, such as charts tracking the flow of containerized grain shipments out of the US.
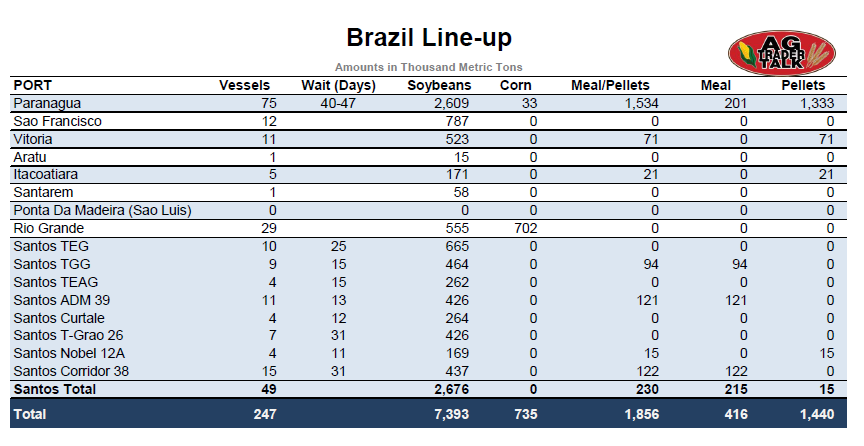
Although we’re located in the US corn belt, in Des Moines, Iowa, we also publish global data which includes South America. Below is a sample of one of the pieces we send to clients which tracks Brazilian logistics and wait-times at ports.
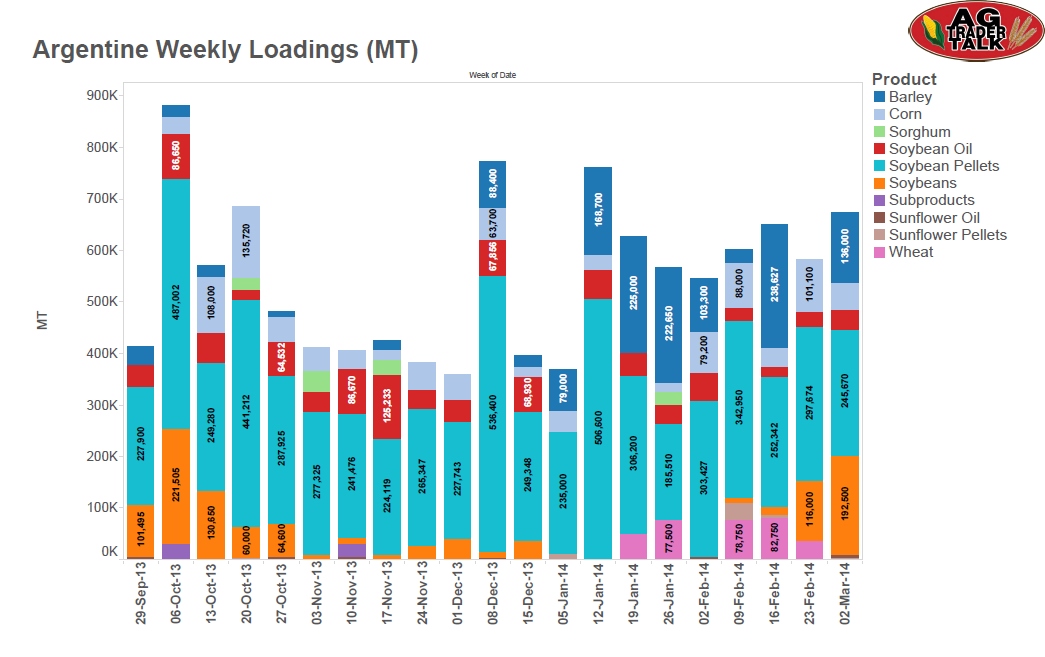
Beside Brazil, we also follow the situation in Argentina, tracking crop conditions, farmer selling, currency effects, exports and more. This allows us to quickly inform clients about the impact when news releases or market chatter turns to Argentina.
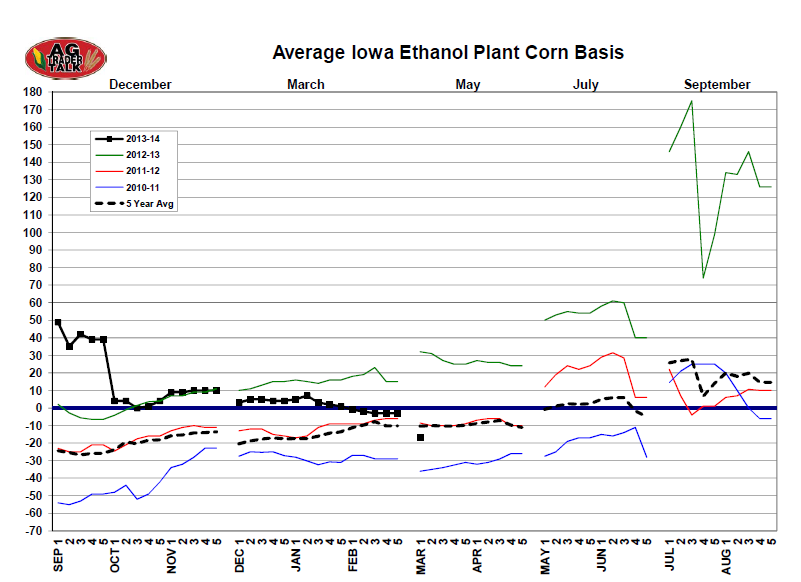
Lastly we are a strong resource for US cash market information. Our tracking of cash markets in the Gulf and interior, along with our extensive historical basis data, gives our clients a better view of physical grain flows in the US.